The Derivative as the Slope of a Tangent Line
Grades 11-12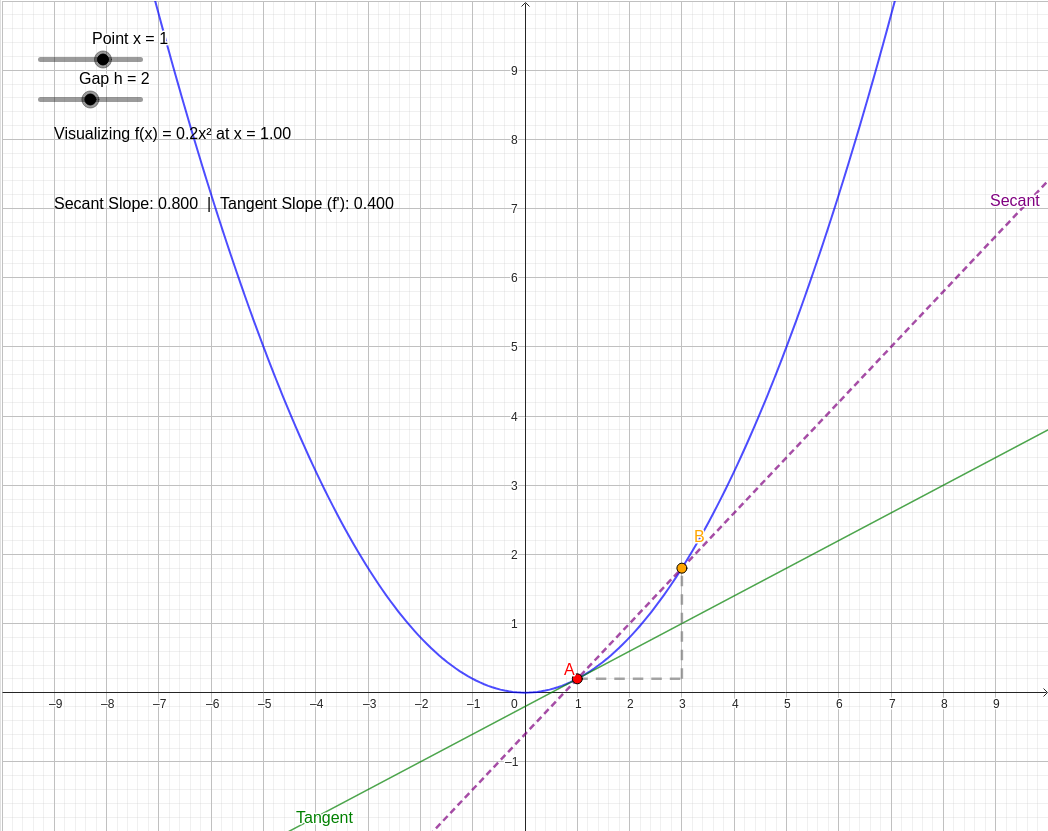
Question: Visualize a tangent derivative
The derivative at a point on a curve represents the instantaneous rate of change, which is geometrically equivalent to the slope of the tangent line at that specific point. To understand how we arrive at this "instantaneous" slope, we use the concept of a limit.
Secant to Tangent
- The Secant Line (Purple Dotted Line): We start by picking two points on the curve: a fixed point A (Red) and a nearby point B (Orange). The line passing through both is called a secant line. Its slope represents the average rate of change between those two points.
- The Gap ( ): The horizontal distance between A and B is often labeled . When is large, the secant line is only a rough approximation of the curve's direction at point A.
- The Limit Process: As you move the slider to decrease the value of , point B slides along the curve toward point A. Notice how the purple secant line rotates and begins to align more closely with the curve at point A.
- The Tangent Line (Green Solid Line): When the gap becomes infinitely small (approaching zero), the two points effectively merge into one. The purple line "limit" becomes the green tangent line. The slope of this green line is the derivative of the function at point A.
Visual Components
- The Curve (Blue): Represents the function .
- Point A: The location where we want to find the derivative. You can use the "Point x" slider to move this along the curve.
- Slope Comparison: The text in the diagram displays the numerical slope of both lines. Observe that as gets smaller, the "Secant Slope" gets closer and closer to the "Tangent Slope."
In the interactive diagram below, you can manipulate the position of the point and the distance of the neighboring point to see this fundamental principle of calculus in action.