Epsilon-Delta Definition of a Limit, Visualized
Grades 11-12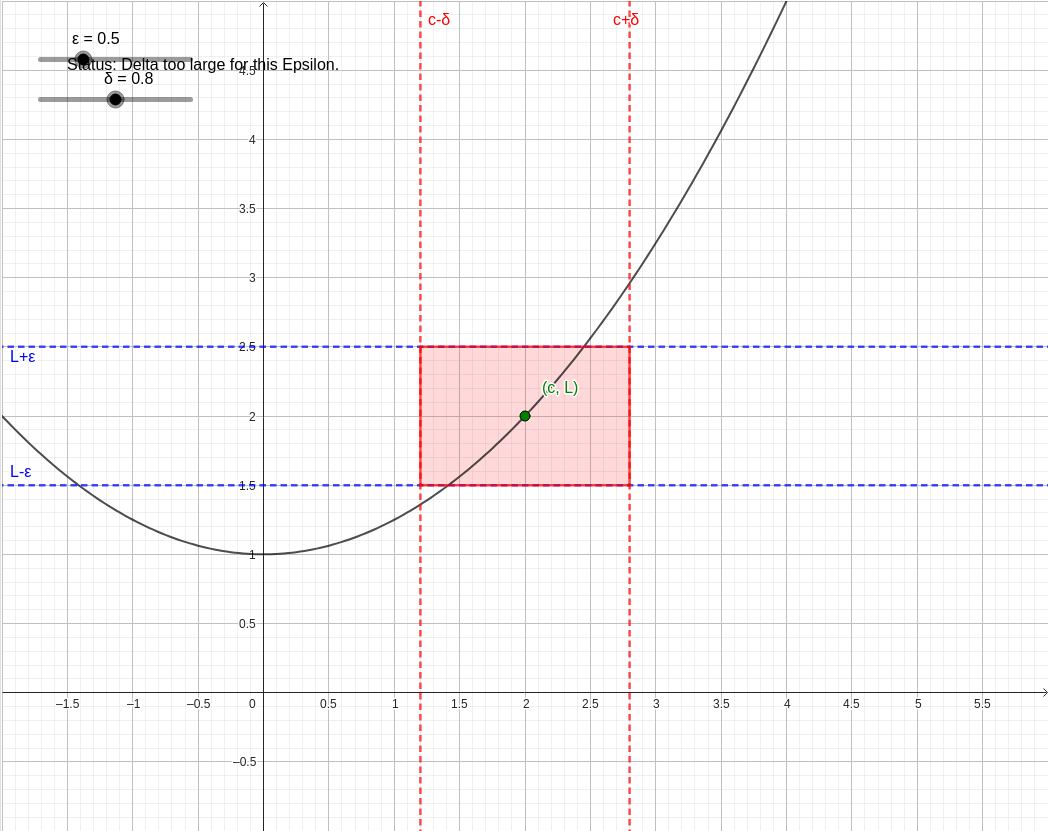
Question: Please help me visualize epsilon delta definition of limit
The formal
(Epsilon-Delta) definition of a limit is the mathematical way of saying that as
gets "arbitrarily close" to a value
, the function
gets "arbitrarily close" to a limit value
.
In the interactive diagram provided:
1. The Challenge ( )
The horizontal blue band represents the "Error Tolerance" or Epsilon (
).
- The limit value is .
- The blue lines are at and .
- In the formal definition, we say: .
- Visually, this means we want the curve to stay inside the blue horizontal "tube."
2. The Response ( )
The vertical red band represents the "Distance" or Delta (
) around our target
-value,
.
- The red lines are at and .
- In the formal definition, we say: .
- Visually, this creates a vertical "window" on the -axis.
3. The Condition for a Limit
The definition of a limit is satisfied if, for any
you choose (no matter how small), we can find a
small enough such that the entire portion of the graph inside the red vertical band also stays inside the blue horizontal band.
How to use the visualization:
- Use the slider to change the vertical tolerance. Notice how the blue band narrows.
- Use the slider to adjust the horizontal window.
- Observe the Target Box (the purple shaded rectangle). For the limit to be valid at , you must be able to adjust the slider so that the function curve (black line) enters the left side of the red band and exits the right side without leaving the top or bottom of the blue band.
The formal mathematical statement is:
As you shrink
toward zero, you can see that we must also shrink
to keep the function "trapped" within the target box. This relationship is the core of calculus.