Dimensionality Reduction Visualized: Unrolling a Swiss Roll
Grades 11-12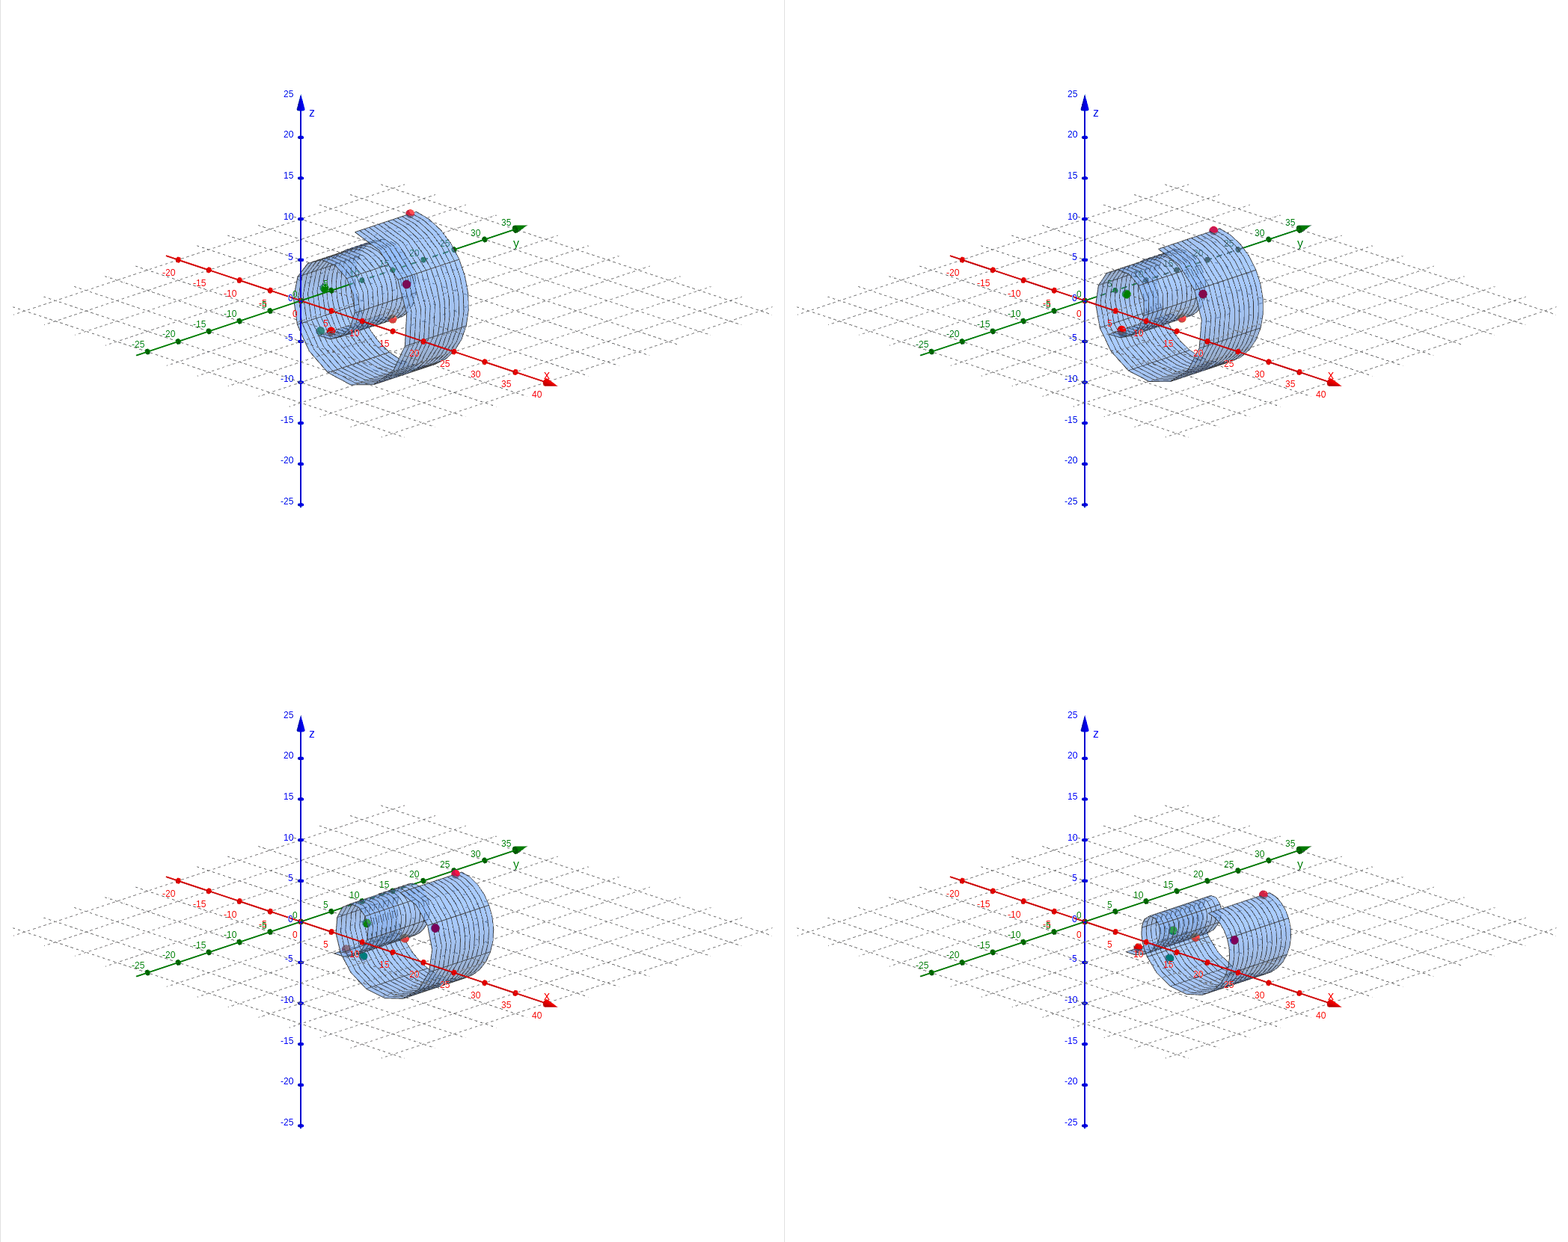
Question: Visualize Dimension reduction (general, e.g. manifold learning) — classic synthetic datasets like a "Swiss roll" or S-curve living in 3D, then unrolled/flattened into 2D. The entire pedagogical point is "here's the 3D shape, here's what it looks like flattened" — you lose the lesson if you can't show the 3D original.
In machine learning and statistics, high-dimensional data often hides a simpler structure known as a manifold. Imagine a sheet of paper: it is a two-dimensional object. However, if you roll that paper into a spiral, it now exists in three-dimensional space. Even though every point on that paper requires three coordinates
to describe its position in the room, the data's "intrinsic" nature is still two-dimensional.
The Swiss Roll is a classic synthetic dataset used to test dimension reduction algorithms. The goal is to "unroll" the manifold to recover the original flat structure. This process is crucial because it allows us to simplify complex data while preserving the important relationships between nearby points.
The Visualization
- The Manifold (Blue Surface): The spiral shape represents our data in its original 3D state. Notice how points on different layers of the spiral might look "close" in 3D space, but they are actually very far apart if you were to travel along the surface of the roll.
- Data Points (Colored Spheres): We have placed several markers on the surface.
- Red and Orange points are placed at the beginning of the roll.
- Green and Teal points are placed in the middle.
- Purple and Pink points are at the outer edge.
- The Unrolling Animation: Watch as the slider moves. The spiral structure is mathematically "flattened." This transformation represents a dimension reduction algorithm (like Isomap or t-SNE) attempting to find a 2D mapping that preserves the local distance between the points.
- The Flat Projection: Once the surface is fully flat, we can see the true distribution of the data without the distortion of the spiral. The points that were "hidden" inside the roll are now clearly visible on a 2D plane.
By flattening the manifold, we reduce the complexity of the data from three variables to two, making it easier to analyze, visualize, and process without losing the underlying structure.