Graph of sin²(3x) Explained
Grades 11-12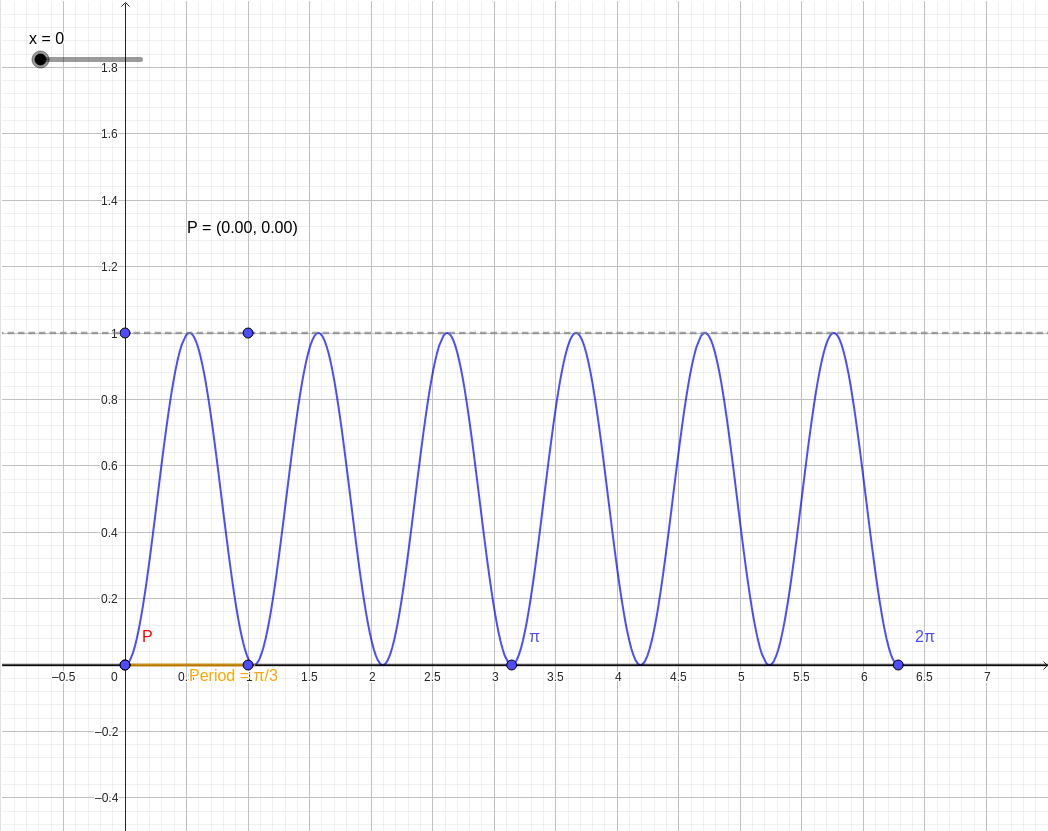
Question: 〖sin^2 (3x), (0≤x≤2x)
The function
is a trigonometric function that incorporates horizontal compression and a vertical transformation (squaring). To understand the behavior of this graph on the interval
, we can break down its components.
1. Horizontal Compression
The coefficient
inside the sine function,
, increases the frequency of the oscillation. While a standard
curve has a period of
, the function
completes one full cycle every
units.
2. The Effect of Squaring
Squaring the function has two major effects:
- Range: Since any real number squared is non-negative, the range of the function shifts from to . The graph never dips below the x-axis.
- Periodicity: Squaring the sine wave effectively doubles the frequency of the peaks because both the original positive and negative peaks of become positive maximums at .
We can see this mathematically using the double-angle identity for power reduction:
3. Key Features of the Graph
- Period: The graph repeats every units. Over the interval , you will see exactly 6 complete cycles.
- Maximum Points: The peaks reach a height of . These occur at
- Minimum Points (Roots): The troughs touch the x-axis ( ) at
In the interactive diagram below:
- The blue curve represents .
- The orange segment on the x-axis highlights one single period of the function ( ).
- The dotted gray line indicates the maximum value of .
- You can move the slider to trace the red point along the curve and observe its coordinates.
法提供 GeoGebra 代码。