Plateau–Rayleigh Instability: Why Liquid Streams Form Droplets
Grades 11-12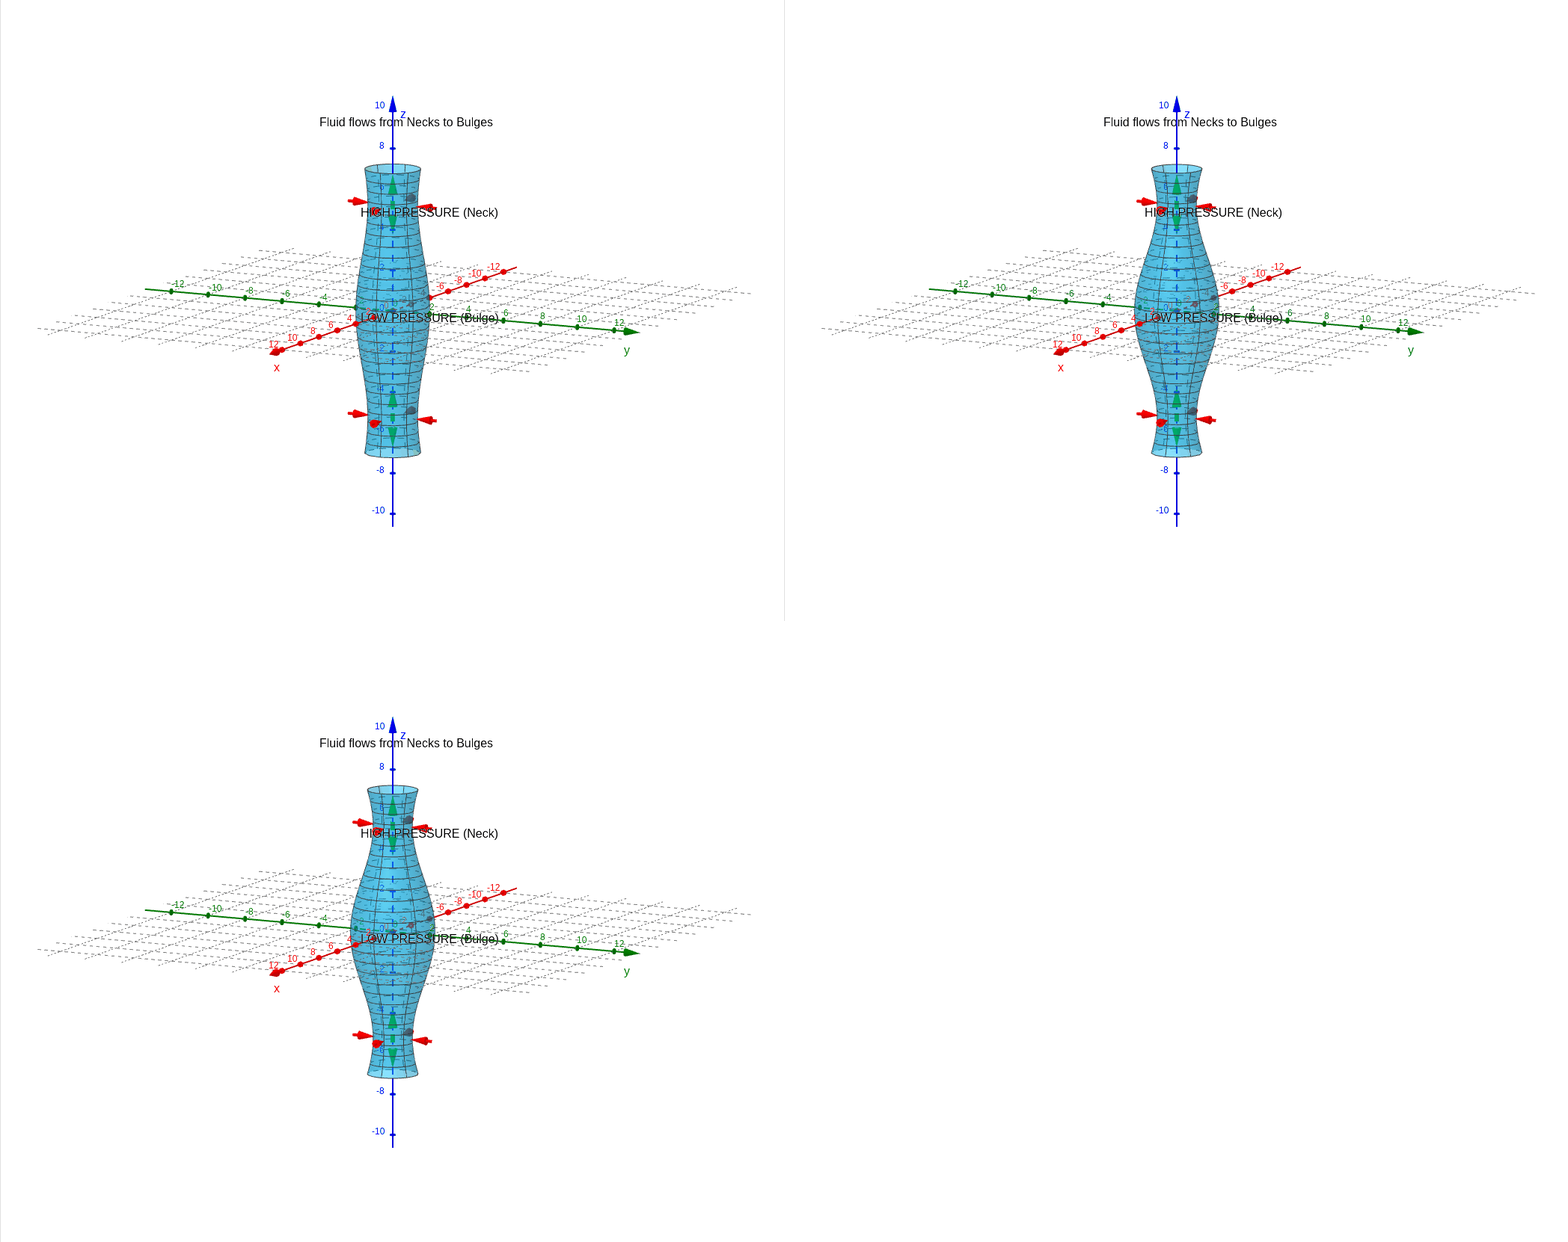
Question: Visualize The Plateau-Rayleigh Instability (Surface Tension & Stability) Since your syllabus specifically mentions the Plateau-Rayleigh Instability as a core aim (Aim #4), this is a unique and sophisticated choice for a "Viscous Flow" project. The "Graphability" Factor: You are graphing the evolution of a liquid jet into droplets. The Visualization: Start with a 3D cylinder (the jet). Apply a sinusoidal perturbation to the radius: R ( z ) = R 0 + ϵ cos ( k z ) R(z)=R 0 +ϵcos(kz) . Pressure Gradients: You can use color to show the Laplace Pressure ( P = γ / R P=γ/R ). In the "necks" of the jet, the radius is small, so the pressure is high. In the "bulges," the pressure is low. The Result: You can animate or graph how the high pressure in the necks "squeezes" the fluid into the bulges until the jet snaps into spheres. It perfectly displays Stability Theory.
The Plateau-Rayleigh instability explains why a thin stream of falling liquid, like water from a faucet, eventually breaks into distinct droplets. This phenomenon is driven by the interaction between surface tension and the geometry of the fluid jet.
1. The Perturbed Liquid Jet
Imagine a cylindrical jet of fluid with an initial radius
. In nature, tiny vibrations or disturbances are always present. We represent these as a sinusoidal wave traveling along the surface of the jet. The radius
at any point along the vertical axis
is defined as:
Here,
represents the amplitude of the disturbance (the "pinch"), and
is the wave number (related to the wavelength
by
). As you adjust the perturbation, you can see the cylinder develop "necks" (where the radius is small) and "bulges" (where the radius is large).
2. Laplace Pressure and the "Squeeze"
The surface tension of the liquid creates an internal pressure known as Laplace Pressure, which is inversely proportional to the radius of curvature (
).
- In the Necks (Red Zones): The radius is at its minimum. This creates a region of high pressure. This high pressure effectively "squeezes" the fluid, pushing it away from the thin sections.
- In the Bulges (Blue Zones): The radius is at its maximum. This creates a region of low pressure.
3. Stability and Flow
Because fluids naturally move from regions of high pressure to low pressure, the liquid is driven out of the necks and into the bulges. This creates a feedback loop: the more the neck thins, the higher the pressure becomes, which pushes even more fluid out.
This process continues until the necks become infinitely thin and "snap," causing the jet to disintegrate into a series of spherical droplets. This occurs specifically when the wavelength of the disturbance is greater than the circumference of the cylinder (
), a condition known as the Rayleigh criterion.
In the visualization:
- The translucent surface represents the boundary of the liquid jet.
- Red arrows at the narrowest points indicate the high-pressure "squeeze" pushing inward.
- Vertical arrows show the direction of fluid flow moving from the high-pressure necks toward the growing bulges.
- The Slider allows you to increase the perturbation amplitude, demonstrating the evolution from a smooth cylinder to the brink of droplet formation.