Rational Function Graph: Asymptotes, Extrema and Inflection Points
Grades 11-12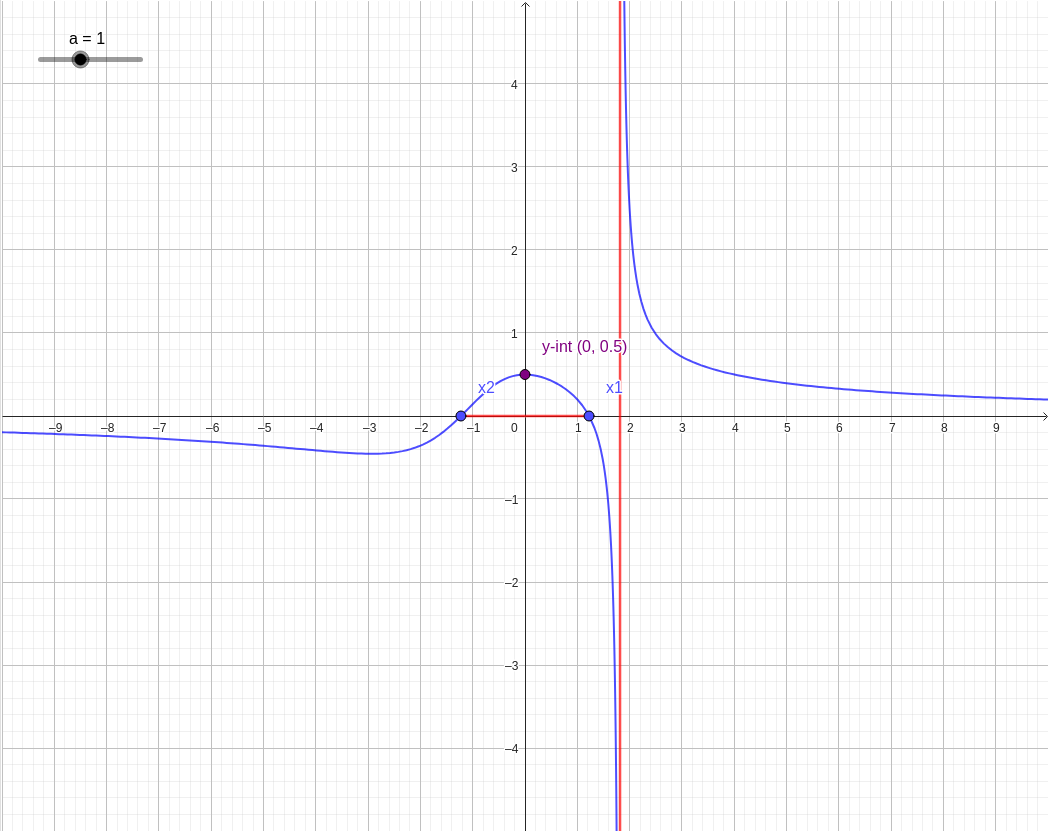
Question: y=\frac{ax^{2}+x^{2}-3}{x^{3}-6}. give a slide of a. draw the graph. give points of inflexion, extrema, asymptotes, xy intercepts
This problem involves curve sketching of a rational function, which is a topic covered in the HKDSE Mathematics Extended Part (Module 1/Module 2) syllabus. In the Compulsory Part, we typically deal with linear and quadratic graphs, but the analysis of asymptotes and points of inflexion requires the use of limits and calculus.
1. Intercepts
To find the intercepts, we examine the cases where
and
.
The function is given by:
.
-
-intercept: Set . The -intercept is always regardless of the value of . [A1]
-
-intercepts: Set , which implies the numerator is zero. If , there are two -intercepts at . [A1] If , there are no real -intercepts.
2. Asymptotes
Asymptotes define the long-term behavior and discontinuities of the graph.
-
Vertical Asymptote: Occurs where the denominator is zero. The vertical asymptote is the line . [A1]
-
Horizontal Asymptote: Examine the limit as . Since the degree of the denominator (3) is greater than the degree of the numerator (2), the denominator grows faster than the numerator. The horizontal asymptote is ( -axis). [A1]
3. Extrema and Points of Inflexion (Calculus Approach)
To find stationary points (extrema), we use the quotient rule for
:
Setting
, we find
.
One stationary point is always at
. By the second derivative test,
is a local maximum if
. [M1]
Points of inflexion occur where
and the concavity changes. Due to the complexity of the second derivative for this rational function, these points are typically solved numerically or by observing the change in curvature across the vertical asymptote and towards the horizontal asymptote.
The following diagram allows you to vary the parameter
to see how the
-intercepts and the curve's shape respond.