Graph of a Periodic Function with Period π/2 (y = sin 4x)
Grades 10-11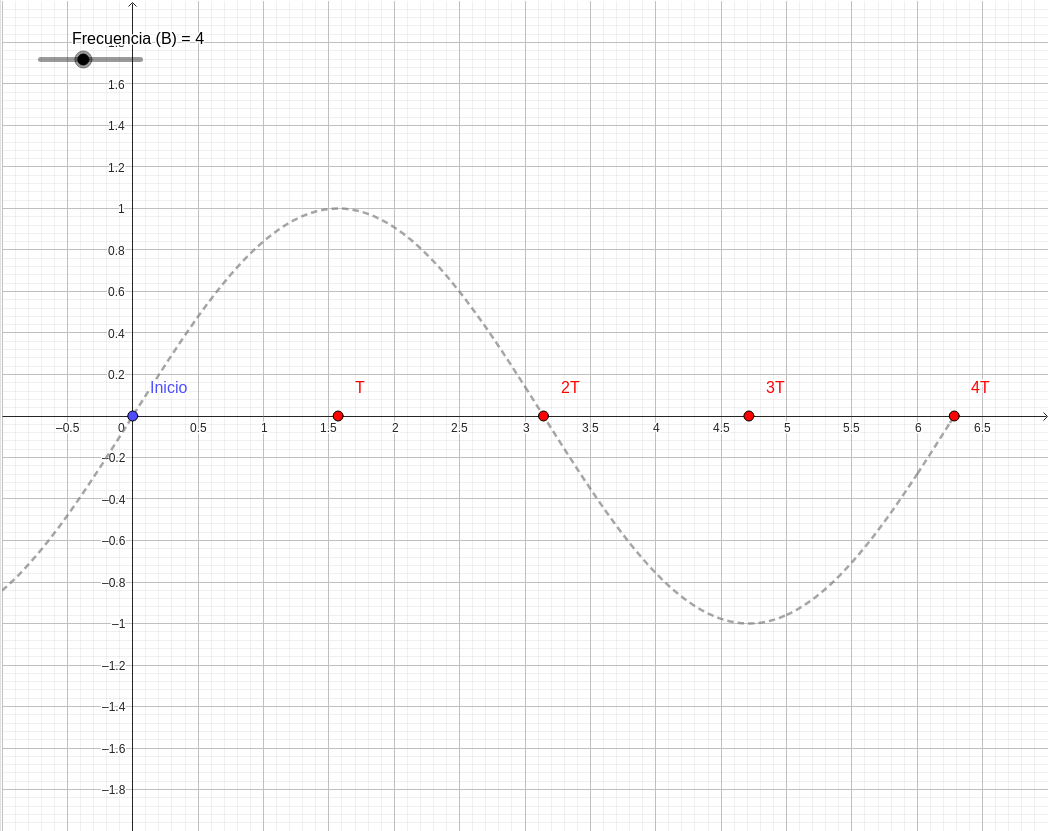
Question: Graph the periodic function with period 2*pi/4.
To graph a periodic function with period
, we first need to understand the relationship between the period and the angular frequency of a basic trig function like sine or cosine.
The general form of a sine function is
, where the period
is given by:
Here, we're asked for a period of
. Comparing the two expressions, it's clear that
must equal
. So the function we'll graph is:
Analyzing the graph:
- Horizontal compression: Unlike the standard function, whose period is , repeats four times faster. This means it completes one full cycle (one rise and one fall) over an interval of length (about units on the x-axis).
- Key points:
- Starts at the origin .
- Reaches its maximum value ( ) at .
- Crosses the x-axis again at .
- Reaches its minimum value ( ) at .
- Completes its first cycle at .
- Frequency: Over one full interval of , you'll see exactly 4 complete oscillations of the blue curve.
In the interactive diagram, the blue curve represents the periodic function. Red dots mark the moments when the function completes a full cycle, so you can clearly see the repetition every
units.