Simplifying 2e^(−x) + 3xe^(−x) to (3x + 2)e^(−x)
Grades 11-12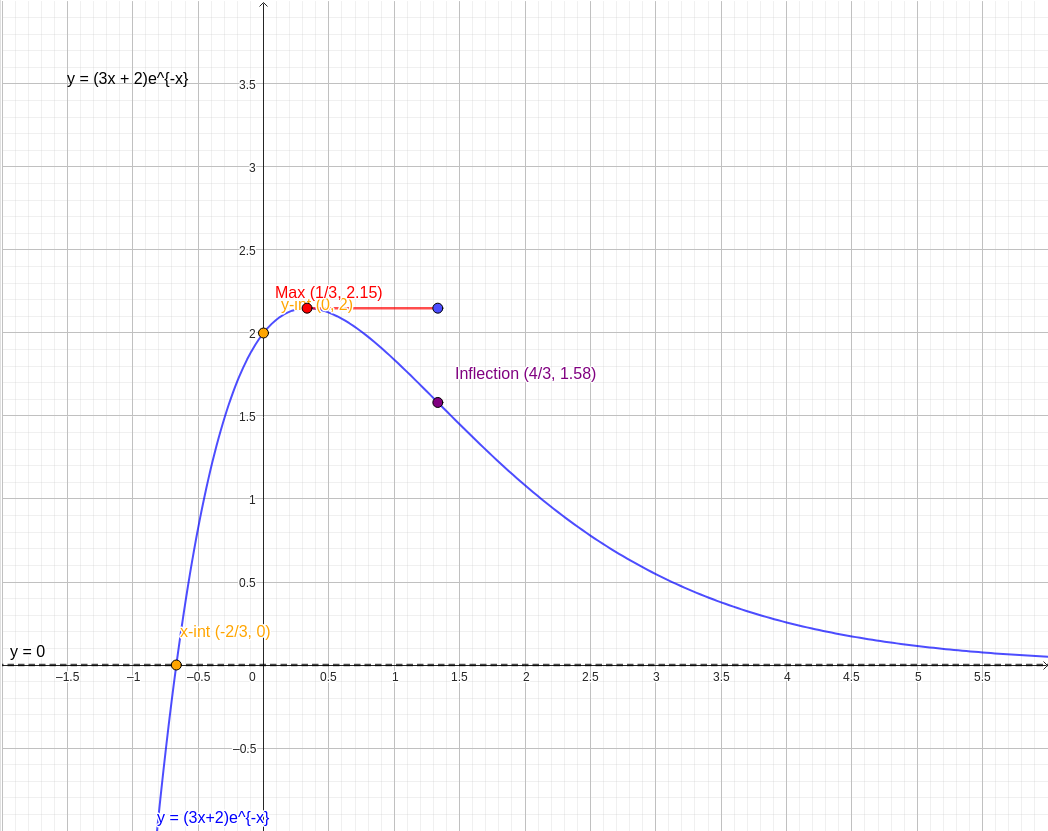
Question: y(x) = 2e^{-x} + 3xe^{-x} = (3x + 2)e^{-x}
The function
is a product of a linear function and an exponential decay function. This combination creates a curve that starts by increasing from negative values, reaches a peak, and then gradually decays toward zero as
increases.
Key Features of the Graph
1. Intercepts The
-intercept is found by setting
:
The
-intercept occurs where
. Since
is never zero, we solve for the linear part:
2. Local Maximum To find the turning point, we calculate the first derivative using the product rule:
Setting
gives
, or
. At this point, the function reaches its global maximum value:
3. Asymptotic Behavior As
, the exponential term
dominates the linear term
, causing the function to approach the x-axis (
). This is represented by the horizontal asymptote shown in the diagram.
4. Inflection Point The second derivative determines the curvature:
Setting
gives
. This is the point where the graph changes from being "concave down" to "concave up" as it flattens out toward the asymptote.
In the provided diagram, the blue curve represents the function. The maximum point is marked in red, the intercepts are marked in orange, and the inflection point is marked in purple. Note how the graph crosses the x-axis at
and then stays above the axis for all larger values of
.