Interquartile Range from a Cumulative Frequency Graph
Grades 9-10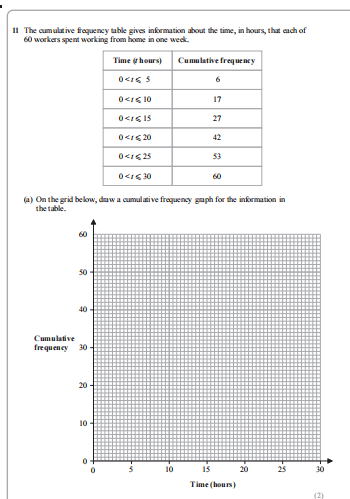
Question: (b) Use your graph to find an estimate for the interquartile range of the times. .............................................................. hours (2) 25 workers spent more than W hours working from home. (c) Use your graph to find an estimate for the value of W W = .............................................................. (2) One of the 60 workers is chosen at random. This worker spent H hours working from home. (d) Find the probability that 5 < H eaqual and smaller 10
To solve these problems using the cumulative frequency graph, we follow the distribution of the 60 workers across the working hours.
(b) Estimating the Interquartile Range (IQR)
The Interquartile Range is the difference between the Upper Quartile (
) and the Lower Quartile (
).
- Lower Quartile (
): This represents the value at
of the total frequency.
- Calculation: .
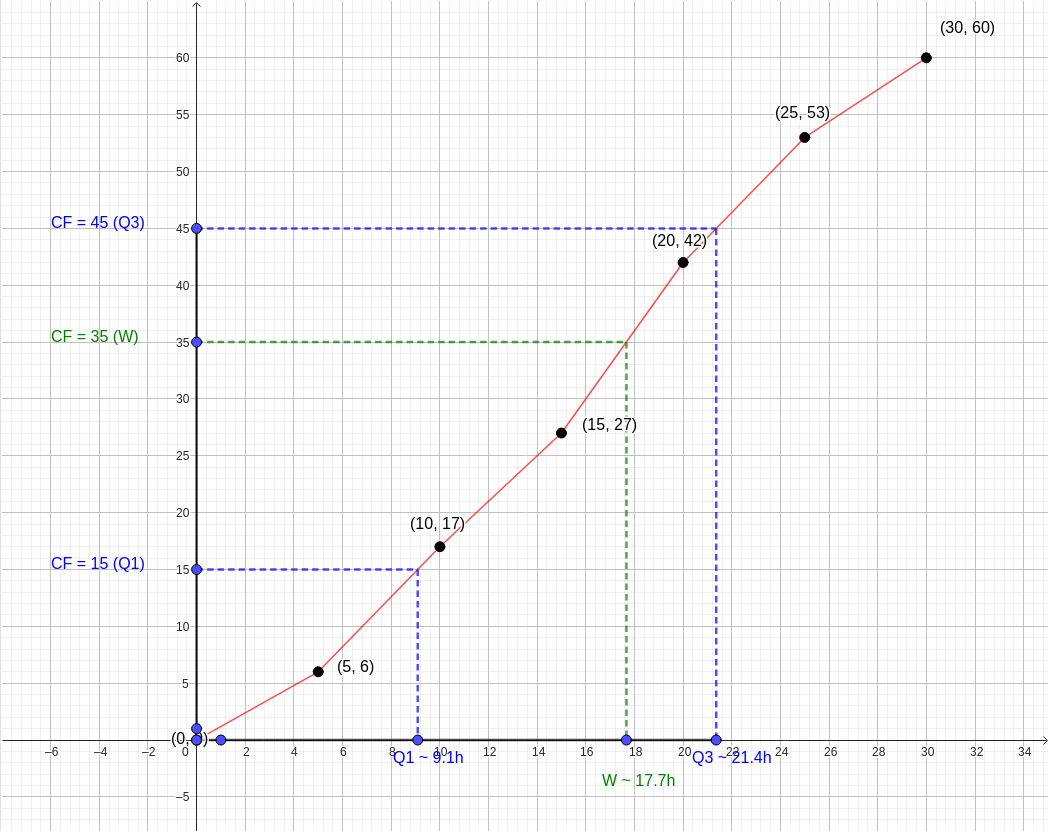
- From the y-axis at (marked with a blue horizontal line), move horizontally to the curve and then vertically down to the x-axis. This gives hours.
- Upper Quartile (
): This represents the value at
of the total frequency.
- Calculation: .
- From the y-axis at (marked with a blue horizontal line), move horizontally to the curve and then vertically down to the x-axis. This gives hours.
- IQR Calculation: hours.
(c) Finding the value of
We are told that 25 workers spent more than
hours working from home.
- Since the total number of workers is 60, "more than 25" corresponds to the bottom workers on the cumulative frequency scale.
- Locate on the y-axis (marked with a green horizontal line). Move horizontally to the curve and then vertically down to the x-axis.
- This indicates hours.
(d) Probability for
To find the probability that a randomly chosen worker spent between 5 and 10 hours working:
- Find the cumulative frequency at : (from the table/graph).
- Find the cumulative frequency at : (from the table/graph).
- The number of workers in this interval is .
- The probability is .
The diagram below visualizes these readings: the points from the table are plotted in black, the cumulative curve is red, and the dashed lines show how to extract the quartiles and
.