Why Adding a Constant Does Not Change Standard Deviation
Grades 9-10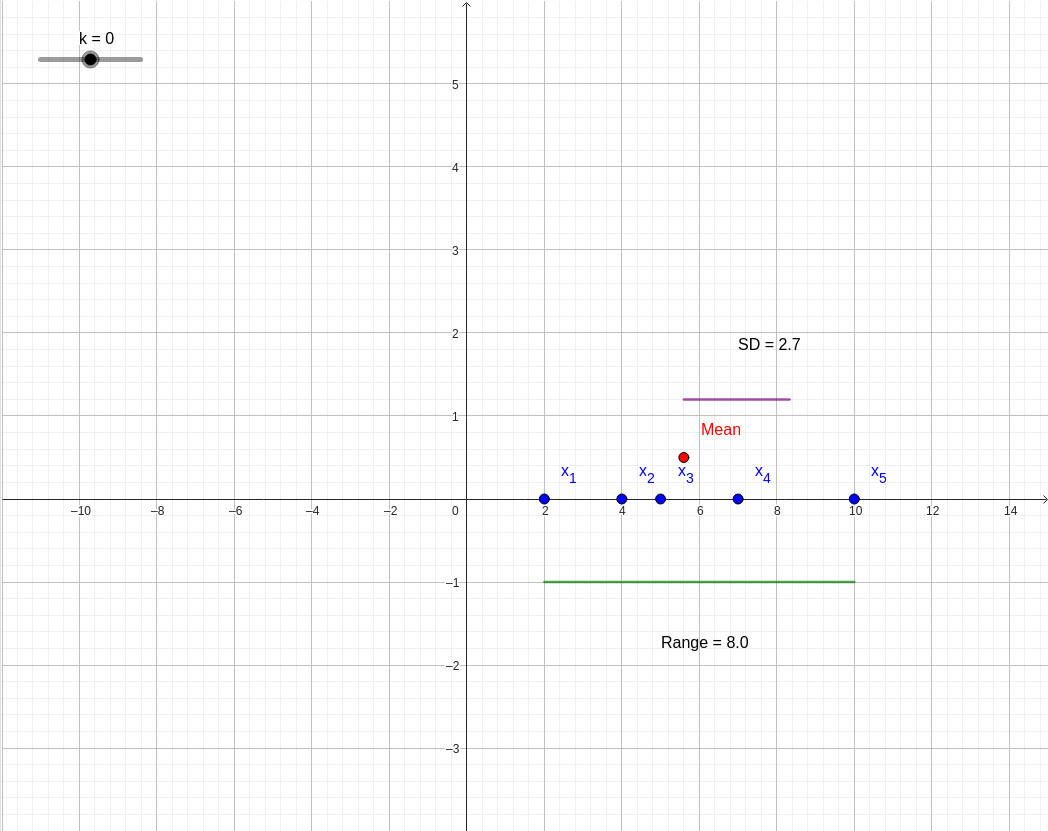
Question: can you visualize Adding a constant never changes dispersion?
In the HKDSE Mathematics syllabus (Compulsory Part), understanding how transformations affect statistical measures is a core competency. When we add a constant to every data point in a set, we are performing a translation of the data distribution.
1. The Concept of Translation
Measures of dispersion—such as Range, Interquartile Range (IQR), and Standard Deviation (SD)—describe the "spread" or "scatter" of a data set. They measure how far apart data points are from each other or from the mean.
Imagine a group of students standing in a line. If every student takes 5 steps to the right, their individual positions change, and the "average position" (mean) shifts 5 steps to the right. However, the distance between the first and last student (Range) and the way they are clustered (SD) remains exactly the same.
2. Mathematical Proof
Consider a data set
. Let
be the new data set after adding a constant
.
A. Change in Mean
The mean increases by the same constant
.
B. Change in Range Let
and
be the maximum and minimum values of the original set.
C. Change in Standard Deviation (
) The standard deviation measures the deviation from the mean:
.
Since the deviation for every point is unchanged, the sum of squares and the resulting standard deviation remain identical to the original.
3. Summary Table for HKDSE
For a transformation
:
| Measure | New Value | Change? |
|---|---|---|
| Mean / Median / Mode | Original + | Yes |
| Range | Original | No |
| Interquartile Range | Original | No |
| Standard Deviation | Original | No |
| Variance | Original | No |
In the visual below, you can use the slider to add a constant
to the data points. Observe that while the cluster moves along the axis, the lengths of the "Range Bar" and "SD Bar" do not change.