3D Yield Surface Graph Explained, with a Heat Map
Grades 11-12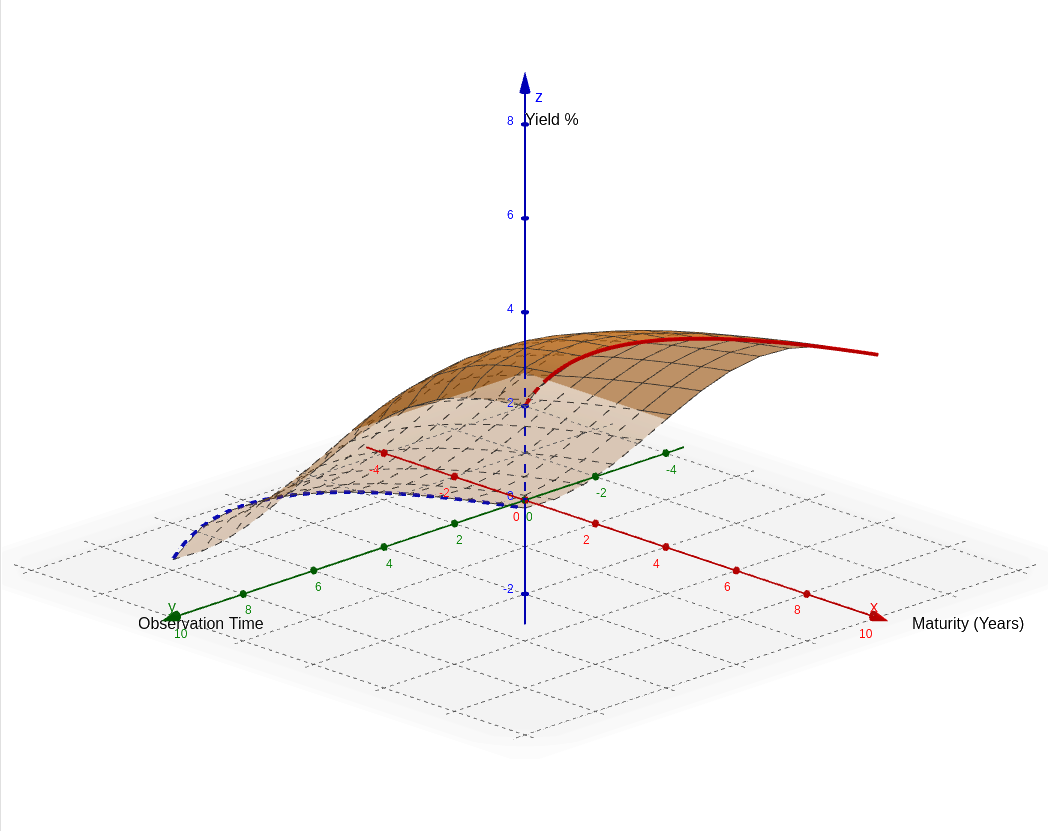
Question: i often see hedge funds / quants having three dimensional graphs - what are those? plot yield surface graph for me with heat map
In the world of quantitative finance and hedge funds, 3D graphs are essential tools for visualizing complex, multi-variable relationships that a flat 2D chart cannot capture. The visualization you are asking about is likely a Yield Surface (or a Volatility Surface).
Understanding the Yield Surface
A standard yield curve shows the interest rates for bonds of different maturities (e.g., 2-year, 5-year, 10-year) at a single point in time. However, interest rates change every day. A Yield Surface adds a third dimension—Time—to create a "landscape" of interest rates.
- The Maturity Axis (X-axis): This represents the "term" of the bond. To the left, you see short-term rates (like 1-month rates), and as you move right, you see long-term rates (like 30-year rates).
- The Calendar Time Axis (Y-axis): This represents the passage of time. As you move along this axis, you are looking at how the entire yield curve shifted from one month to the next.
- The Yield/Height (Z-axis): The vertical height of the surface represents the interest rate percentage. Higher peaks mean higher interest rates.
- The Heat Map (Color): In quant platforms, colors are used to provide immediate visual feedback. Typically, "Hot" colors (Red/Orange) indicate high interest rates or high volatility, while "Cool" colors (Blue/Green) indicate lower values.
Why Quants Use This
Quants look for "wrinkles" or "holes" in this surface. A perfectly smooth surface suggests the market is in equilibrium. However, if a specific part of the surface dips or spikes unexpectedly compared to the areas around it, it may indicate a mispricing. Traders use these 3D models to spot arbitrage opportunities or to see how the "term structure" of interest rates is evolving during a financial crisis.
In the visualization below, you will see a simulated yield surface. Notice how the "front" of the surface (short maturities) is often more volatile and lower than the "back" (long maturities), creating the characteristic upward slope known as a Normal Yield Curve.