Straight-Line Graph of log_p y against x
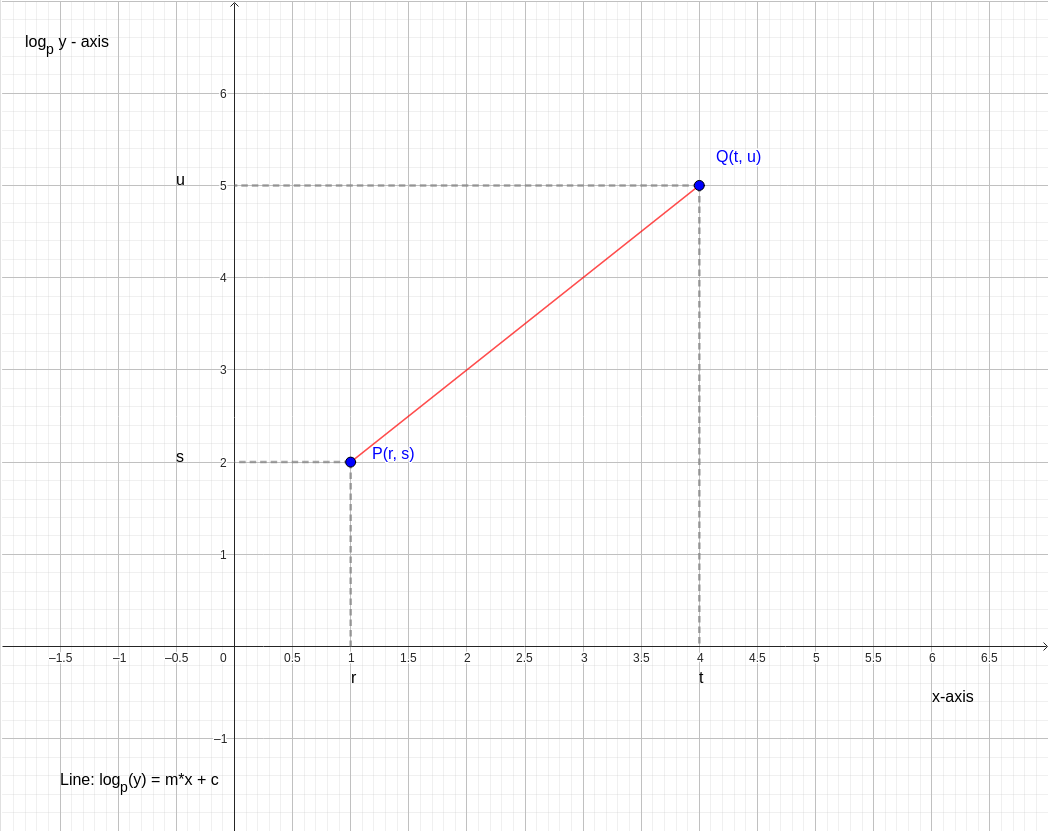
Question: Plot a graph of log y base of p-axis vs x-axis, where a straight line passes through (r,s) and (t,u).
In the HKDSE Mathematics syllabus, linear relations between
and
are frequently tested to represent exponential relationships of the form
.
1. Defining the Variables and the Linear Form
Let the axes be defined as:
- Horizontal coordinate:
- Vertical coordinate:
The straight line passes through the two points
and
on the
-plane, meaning:
- When ,
- When ,
2. Equation of the Straight Line
The slope
of the straight line is given by:
Using the point-slope form with the point
:
Substituting
and
:
Rearranging into slope-intercept form:
where the vertical intercept
is:
3. Converting to the Non-linear Relation ( in terms of )
Applying the definition of logarithm
:
Let
and
, then:
4. Key Visual Features on the Graph
- Points and : Marked in blue, showing the two coordinate pairs on the transformed axes.
- Slope Triangle: The horizontal run and vertical rise represent the rate of change of the logarithm.
- Vertical Intercept: The value of when , equal to .