Greatest and Least IQR of a Frequency Distribution
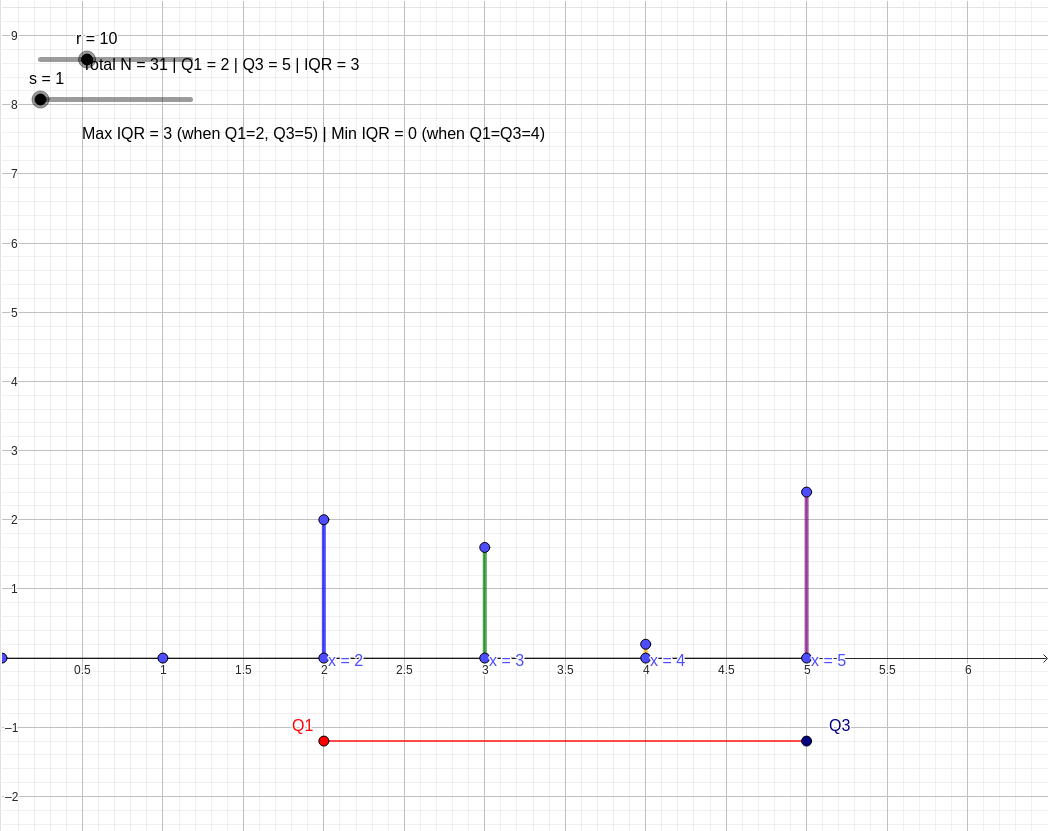
Question: for a group of data, if 2;r, 3;8, 4;s, 5;12, find the greatest possible and least possible value of the IQR of the distribution, and explain how to think
Understanding the Problem
We are given a frequency distribution for a discrete dataset consisting of four distinct values:
- Value with frequency
- Value with frequency
- Value with frequency
- Value with frequency
The total number of data values is:
The Interquartile Range (IQR) measures the spread of the middle
of the data:
where
is the first quartile (
percentile) and
is the third quartile (
percentile).
Step-by-Step Analysis
1. Maximum Possible Value of IQR
Because the data values range strictly from
to
:
- The minimum possible value for is .
- The maximum possible value for is .
Therefore, the maximum theoretical interquartile range is:
Can this maximum actually be achieved?
- To make , we need enough occurrences of so that the percentile falls at . This requires to be sufficiently large (roughly ).
- To make , the percentile must fall at . Since the frequency of is fixed at , we need , which implies .
Choosing
and
:
- Total data points: .
- The dataset in order is:
- Lower quartile falls at the position, which is .
- Upper quartile falls at the position, which is .
- .
Thus, the greatest possible value of the IQR is
.
2. Minimum Possible Value of IQR
The minimum theoretical difference between two quartiles in any distribution is
(which occurs when
).
Can this minimum actually be achieved?
- If we make arbitrarily large (e.g., ), the value dominates the dataset.
- For , .
- Both the percentile and the percentile will fall in the block of 's.
- Therefore, and , giving:
Thus, the least possible value of the IQR is
.
Summary of Results
- Greatest possible IQR:
- Least possible IQR:
Below is an interactive visualization demonstrating how varying frequencies
and
dynamically shifts
,
, and the resulting
.